Motivation - Rotationsmatrix
- Matrixmultiplikationen sind in der Regel sehr rechenintensiv
- Dies soll am Beispiel des Skalarproduktes verdeutlicht werden
Skalarprodukt als einfachste Matrixmultiplikation
- Benötigt
 Aufgabe
- Schreiben Sie ein Skript, das alle Zahlen zweier gleich langer Listen elementweise multipliziert und die Ergebnisse auf-addiert (entsprechend einer Matrixmultiplikation)
Ausgangslage - matmul_start.py
import random
import time

#Set a random seed
random.seed(42)

# Define the range for random numbers
min_value = 1  # Minimum value
max_value = 100  # Maximum value

# Generate the two lists of 10_000_000 random numbers each
list1 = [random.randint(min_value, max_value) for _ in range(10000000)]
list2 = [random.randint(min_value, max_value) for _ in range(10000000)]

start_time = time.perf_counter()
# Continue here:
Lösung - Python native
- Timing mit
time.perf_counter() zip()um zwei Listen gleichzeitig zu durchlaufen
Musterlösung - matmul_solution_native.py
# Start the timer
start_time = time.perf_counter()

result = 0

for first_number, second_number in zip(list1, list2):
    multiplication_result = first_number * second_number
    result = result + multiplication_result

print("--- %s seconds ---" % (time.perf_counter() - start_time))
print(result)
- Resultat: ca. 0.7 Sekunden (früher ca. 2.8 Sekunden)
Lösung - Numpy
- Import des Pakets
numpy→ normalerweise mit Aliasnp - Umwandeln der Listen in
numpyArrays np.matmul()bzw.@für die Matrixmultiplikation
Musterlösung - matmul_solution_numpy.py
# Paket für numerische Aufgaben im Python
import numpy as np

# Umwandlung der Listen in numpy arrays
# vgl. Konstruktor
array1 = np.array(list1, dtype=np.int64)
array2 = np.array(list2, dtype=np.int64)

# %%
start_time = time.perf_counter()

# Aufruf der Funktion für Matrixmultiplikation des Pakets numpy
result = np.matmul(array1, array2)
print("--- %s seconds ---" % (time.perf_counter() - start_time))
print(result)
- Resultat: ca. 0.0166 Sekunden → ca. 40-fach schneller
 Lösung - C
- Ergebniss lässt sich auch mit C-Implementierung vergleichen
- Üblicherweise noch schneller als
numpy - Mit Compiler-Flag
-O3optimieren
Musterlösung - matmul_solution_c.c
int main(){
    int amt = 10000000;

    int* list1 = malloc(sizeof(int) * amt);
    int* list2 = malloc(sizeof(int) * amt);
    if(list1 == NULL) { printf("Not enough memory!"); return -1; }
    if(list2 == NULL) { printf("Not enough memory!"); return -1; }

    for(int i = 0; i < amt; i++){
        list1[i] = (rand() % 100) + 1;
        list2[i] = (rand() % 100) + 1;
    }

    //Start matrix multiplication
    long result = 0;
    clock_t begin = clock();
    for(int i = 0; i < amt; i++){
        result += list1[i] * list2[i];
    }
    clock_t end = clock();

    double time_spent = (double)(end - begin) / CLOCKS_PER_SEC;
    printf("Execution time: %f\n Result is %ld\n", time_spent, result);

    free(list1); free(list2);
    return 0;
}
- Resultat: ca. 0.0065 Sekunden → ca. 4-fach schneller als
numpy
NumPy: Numeric Python
Praktisches Arbeiten mit numpy in Python
numpy - Arrays
- Arbeitet mit (mehrdimensionalen) Arrays (
numpy.ndarray) - Objekt, das numerische Daten eines gemeinsamen Types (
dtype) sammelt → unterscheidet sich dadurch von Listen - Klasse bietet verschiedene Attribute und Methoden an
Beispiel
# Zweidimensionales Array
a = np.array([[1, 2, 3, 4], [5, 6, 7, 8], [9, 10, 11, 12]])

# Form des Arrays
a.shape
#> (3,4)

# Typ der Zahlen im Array
a.dtype
#> dtype('int64')

# Zugriff auf erste Zeile
print(a[0])
#> array([1 2 3 4])

# Zugriff auf zweites Element der ersten Zeile
print(a[0][1])
#> 2
numpy - Erstellen von Arrays
- Können direkt aus Python
list-Objekten erstellt werden - Weitere standardisierte Methoden zur Erstellung von Arrays als Funktionen in
numpyenthalten
Beispiel
np.zeros(2)
#> array([0., 0.])

np.arange(4)
#> array([0, 1, 2, 3]

np.linspace(0, 10, num=5)
#> array([ 0., 2.5, 5., 7.5, 10.])

np.eye(3)
#>array([[1., 0., 0.],
#>       [0., 1., 0.],
#>       [0., 0., 1.]])

np.logspace(1, 3, num=5)
#> array([10., 31.6227766, 100., 316.22776602, 1000.])

np.empty([2, 2]) # uninitialisierte Werte --> wie in C(++)
#> array([[ -9.74499359e+001,   6.69583040e-309],
#>        [  2.13182611e-314,   3.06959433e-309]])
numpy - Slicing
- das Auswählen von Teilbereichen (Slices) funktioniert analog zu Listen

- Filtern ist ebenfalls durch die Eingabe von Filter-Kriteria in die eckigen Klammern möglich
- Dabei beziehen sich die Zahlen auf die Werte im Array und nicht auf die Indexpositionen
Beispiel - Filtern
a = np.array([[1, 2, 3, 4], [5, 6, 7, 8], [9, 10, 11, 12]])

c = a[(a > 2) & (a < 11)]
print(c)
#> [ 3  4  5  6  7  8  9 10]
numpy - Nützliche Funktionen/Methoden
- Viele Funktionen sind direkt als Methoden der
numpy.ndarray-Klasse verfügbar - Andere als Funktionen des
numpy-Pakets - Teils sind beide Varianten verfügbar → Methode operiert direkt auf dem Array, Funktion erstellt neues Array als Kopie
Weitere nützliche Methoden
data = np.array([1, 2, -3, 10, 15, -20])

data.max()
#> 15.0
data.min()
#> -20.0
data.sum()
#> 5.0
data.mean()
#> 0.8333333333333334
Weitere nützliche Funktionen
np.argmax(data)
#> 4
np.resize(data, (2, 3))
#>array([[  1,   2,  -3],
#>       [ 10,  15, -20]])
numpy - math. Operationen
- Die meisten Operationen der linearen Algebra sind für
numpyArrays implementiert- Multiplikation mit einem Skalar:
scalar * matrix - Elementweise Addition zweier gleich dimensionaler Matritzen
matrix + matrix - Elementweises Anwenden von Funktionen
np.square(...)
- Multiplikation mit einem Skalar:
Arbeiten mit Formeln

 numpy - Broadcasting
numpyermöglicht Operationen auf Arrays unterschiedlicher Form- Arrays werden automatisch erweitert, um die Operation durchzuführen
Beispiel
a = np.array([1, 2, 3])
b = 2
print(a * b)
#> array([2, 4, 6])
- Funktioniert auch in der Anwendung auf Funktionen → in
f(x)wird der Skalarb"ausgedehnt" auf die Größe vona
Beispiel
def f(a):
  b = 1
  return a + b

arr = np.array([1, 2, 3, 4, 5])
print(f(arr))
 Aufgabe
- Wir wollen nun ein Beispiel aus der Mechatronik mit
numpylösen- Die Übertragungsfunktion
- Der Frequenzgang soll mit
numpyberechnet werden - Der Frequenzgang soll geplottet werden → muss den Anforderungen an einen wissenschaftlichen Plot entsprechen
Fehlerfortpflanzung für Bauteiltoleranzen (R & C) soll berechnet werden
- Die Übertragungsfunktion
Start - numpy_example_filters_inclass_start.ipynb
- Auf dieses Notebook soll aufgebaut werden
Vollständige Musterlösung - numpy_example_filters.ipynb
- Klasse für RC-Tiefpassfilter
- Berechnung des Frequenzgangs
- etc.
Matplotlib: Visualization with Python
Motivation - Wissenschaftliche Plots
- Wir wollen in der Lage sein Daten zu visualiseren
- Dabei wollen wir uns an wissenschaftlichen Standards orientieren → z.B.: für Laborberichte, BA-Arbeiten, etc.
- Hier gibt es einige Regeln, die es zu beachten gilt → viel davon schon automatisch mit
matplotlibumsetzbar
Leitfaden: Zitieren und Abbildungen
- Achsen mit Einheiten beschriften (
- Transparenter oder weißer Hintergrund
- Unterschiedliche Linien auch in schwarz-weiß Kopie unterscheidbar (z.B. durch gestrichelte Linien)
- Vektorgrafik (nicht verpixelt)
Matplotlib - Erster Plot
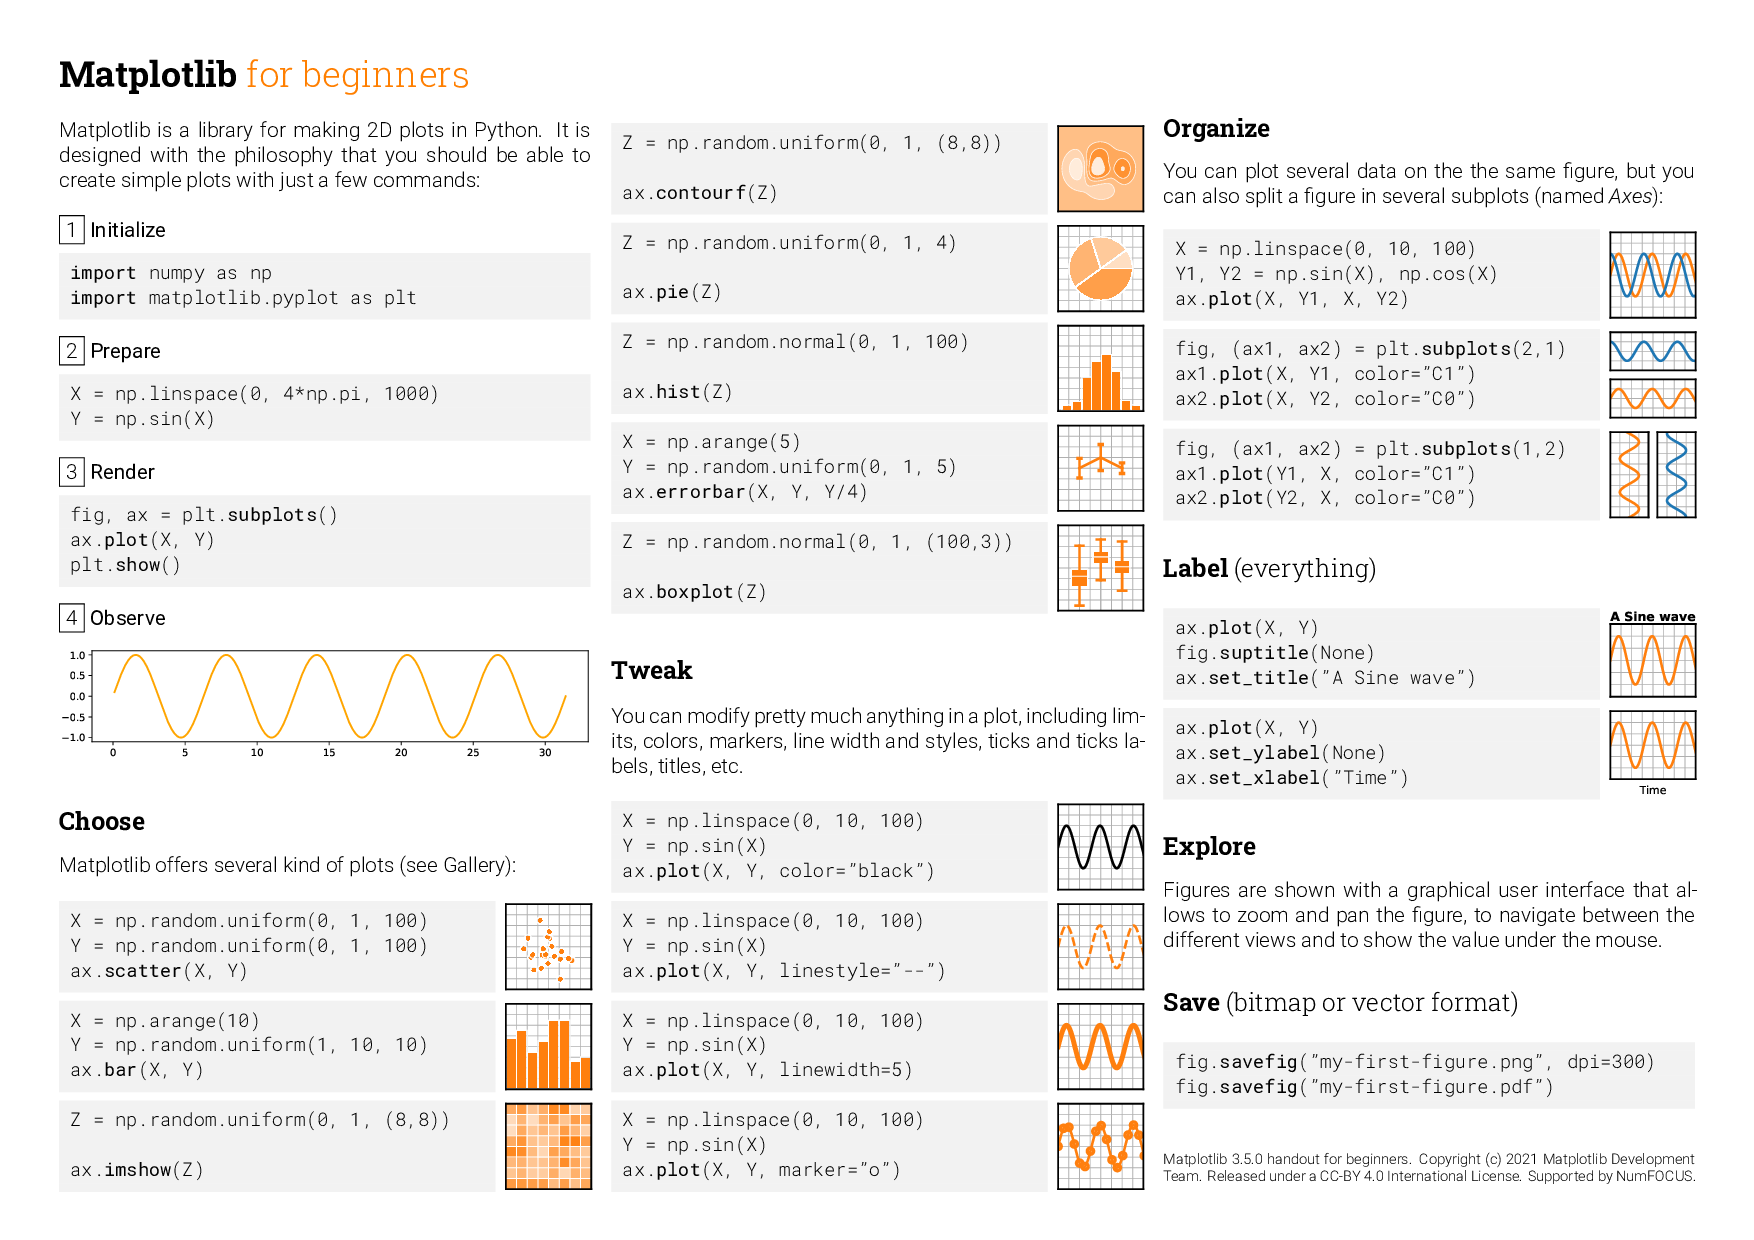
matplotlibPlots sind aus "Bausteinen" (siehe rechts) aufgebaut
Beispiel scatter.py
import numpy as np
import matplotlib.pyplot as plt

# generate data to be plotted
x = np.arange(0, 10, 0.1)
y = np.random.rand(100)

# create figure and axis
# to plot on
fig, ax = plt.subplots()

ax.plot(
  x, #data to plot
  y, #data to plot
  marker='o', #opt. marker style
  linestyle='None' #opt. linestyle
)
plt.show() #actually show it
 Matplotlib - Cheat Sheets

Matplotlib - Styling
matplotlibbietet viele Möglichkeiten zur Anpassung der Plotsax.plot( x, y, color="g", marker="o", markersize=12, markevery=25, markerfacecolor="b", markeredgecolor="r", linestyle="--", linewidth=2, label="Datenpunkte" )color: Gibt Farbe anmarker&markersize: Geben Form & Größe der Marker anmarkevery: Gibt an, wie oft ein Marker gezeichnet wirdmarkerfacecolor&markeredgecolor: Farbe des Markerslinestyle&linewidth: Geben Stil & Breite der Linie anlabel: Legendeneintrag für dieses Element
Matplotlib - Styling
- Beispiel von oben
Beispiel - styling.py
import numpy as np
import matplotlib.pyplot as plt
x = np.linspace(0.1, 10*np.pi, 1e3)
y = np.sin(x)
#create figure and axis
fig, ax = plt.subplots()
ax.plot(
    x, y,
    color="g",
    marker="o",
    markersize=12,
    markevery=25,
    markerfacecolor="b",
    markeredgecolor="r",
    linestyle="--",
    linewidth=2,
    label="Datenpunkte"
)
plt.tight_layout()
plt.show()
#plt.savefig("plot.svg")
Matplotlib - Farbdarstellung
- Farben können in verschiedenen Formaten angegeben werden
- Eingebaute (Grund-)farben über einzelne Buchstaben verwendbar:
color = "b": blaucolor = "g": grüncolor = "k": schwarzcolor = "mediumseagreen":
- Grautöne als String im Bereich von 0-1 →
color = "0.75" - Allgemeine Farben als Hex-Code oder RGB-Tupel im Bereich [0, 1]
color = "#eeefff"color = [0.1, 0.3, 0.9]
 Matplotlib - Farbdarstellung
Beispiel: MCI-Blau
- Gewöhnliches RGB-Tupel wie in z.B. GIMP oder Photoshop →
color = [28, 69, 113]→ sind mit 8-Bit Farbtiefe kodiert - Übliche RGB-Farbwerte umrechnen →
color = [28/255, 69/255, 113/255] - Angabe für matplotlib:
color = [0.11, 0.27, 0.44]

Matplotlib - Bildformate
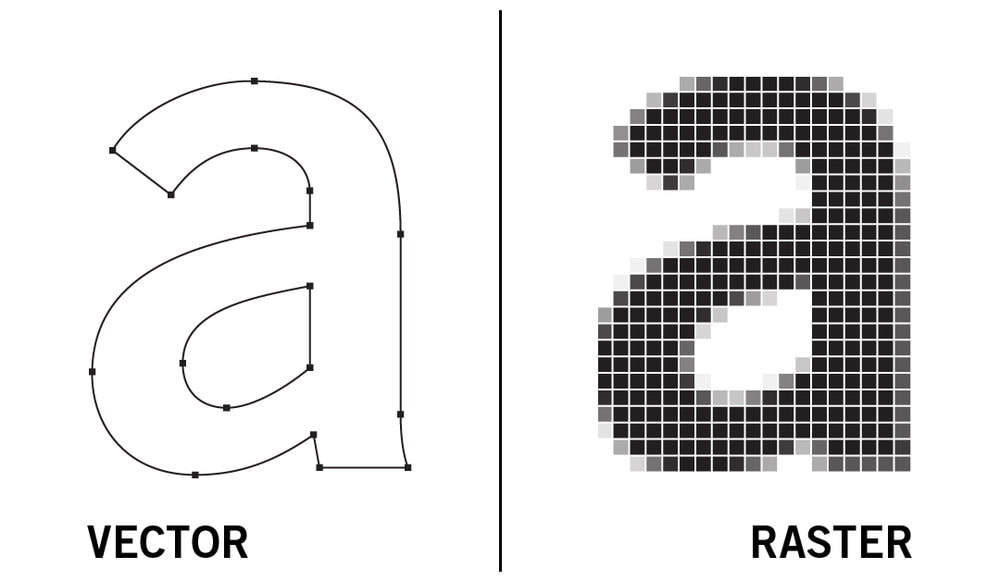
Rastergrafiken
- Bild wird über Raster von einzelnen Pixeln dargestellt → beim Vergrößern muss interpoliert werden → sieht unprofessionell aus
- Übliche Rasterformate:
*.bmp,*.png,*.jpg,*.gif,*.tiff, etc.
Vektorgrafiken
- Speichern Bilder auf der Grundlage von Regeln (normalerweise in einer Auszeichnungssprache) → Linien, Polygone, etc. werden definiert → kann beliebig vergrößert werden
- Übliche Vektorformate:
*.pdf,*.svg,*.eps, etc.# Beispiel für das Speichern als Vektorgrafik plt.savefig("test.pdf")

Alternativen zu Matplotlib
- In Python gibt es drei große Module, die häufig zur Erstellung von Diagrammen verwendet werden:
Module zur Visualisierung
- matplotlib:
- wirkt etwas altmodisch, komplizierte Befehle, wenig aufgeräumt
- seaborn:
- baut auf matplotlib auf, man erhält schneller schöne Graphen, basierend auf
"tidy data"Prinzipien
- baut auf matplotlib auf, man erhält schneller schöne Graphen, basierend auf
- plotly:
- modernes Design, ermöglicht interaktive Grafiken
 Aufgabe
- Um das Verständnis für
matplotlibweiter zu vertiefen kann das hier verlinkte Notebook bearbeitet werden. - Notebook: matplotlib - Daten visuell darstellen
 Hausübung
- Erweitern Sie die Datenverarbeitungs-Pipeline aus der letzten Hausübung um die Möglichkeit Polynome auf die Daten zu fitten
- Nutzen Sie hierzu NICHT die direkten Funktionen von
numpysondern implementieren Sie die Berechnung selbst → dies ist durch aufstellen & lösen eines linearen Gleichungssystems möglich - Plotten Sie anschließend die Datenpunkte und das gefittete Polynom